The Oracle guys running the Big Data 4 the Enterprise Meetup are always apologetic about marketing. The novelty is quite amusing. They do this because most Big Data Meetups are full of brash young people from small start-ups who use cool open source software. They choose cool open source software partly because they're self-styled hackers who like being able to play with their software any way they choose. But mainly it is because the budgetary constraints of being a start-up mean they have to choose between a Clerkenwell office and Aeron chairs, or enterprise software licenses, and that's no choice at all.
But an Oracle Big Data meetup has a different constituency. We come from an enterprise background, we've all been using Oracle software for a long time and we know what to expect from an Oracle event. We're prepared to tolerate a certain amount of Oracle marketing because we want to hear the Oracle take on things, and we come prepared with our shields up. Apart from anything else, the Meetup sponsor is always cut some slack, in exchange for the beer'n'pizza.
Besides the Oracle Big Data Appliance is quite at easy sell, certainly compared to the rest of the engineered systems. The Exa stack largely comprises machines which replace existing servers whereas Big Data is a new requirement. Most Oracle shops probably don't have a pool of Linux/Java/Network hackers on hand to cobble together a parallel cluster of machines and configure them to run Hadoop. A pre-configured Exadoop appliance with Oracle's imprimatur is just what those organisations need. The thing is, it seems a bit cheeky to charge a six figure sum for a box with a bunch of free software on it. No matter how good box is. Particularly when it can be so hard to make the business case for a Big Data initiative.
Stephen Sheldon's presentation on Big Data Analytics As A Service addressed exactly this point. He works for Detica. They have stood up an Oracle BDA instance which they rent out for a couple of months to organisations who want to try a Big Data initiative. Detica provide a pool of data scientists and geeks to help out with the processing and analytics. At the end of the exercise the customer has a proven case showing whether Big Data can give them sufficient valuable insights into their business. This strikes me as a highly neat idea, one which other companies will wish they had thought of first.
Ian Sharp (one of the apologetic Oracle guys) presented on Oracle's Advanced Analytics. The big idea here is R embedded in the database. This gives data scientists access to orders of magnitude more data than they're used to having on their desktop R instances. Quants working in FS organisations will most likely have an accident when they realise just how great an idea this is. Unfortunately, Oracle R Enterprise is part of the Advanced Analytics option, so probably only the big FS companies will go for it. But the Oracle R distro is still quite neat, and free.
Mark Sampson from Cloudera rounded off the evening with a talk on a new offering, Cloudera Search. This basically provides a mechanism for building a Google / Amazon style search facility over a Hadoop cluster. The magic here is that Apache Solr is integrated into the Hadoop architecture instead of as a separate cluster, plus a UI building tool. I spent five years on a project which basically did this with an Oracle RDBMS, hand-rolled ETL and XML generators and lots of Java code plumbing an external search engine into the front-end. It was a great system, loved by its users and well worth the effort at the time. But I expect we could do the whole thing again in a couple of months with this tool set. Which is good news for the next wave of developers.
Some people regard attending technical meetups a bit odd. I mean, giving up your free time to listen to a bunch of presentations on work matters? But if you find this stuff interesting you can't help yourself. And if you work with Oracle tech and are interested in data then this meetup is definitely worth a couple of hours of your free time.
Showing posts with label Big Data. Show all posts
Showing posts with label Big Data. Show all posts
Thursday, October 10, 2013
Thursday, July 11, 2013
UKOUG Analytics Event: a semi-structured analysis
Yesterday's UKOUG Analytics event was a mixture of presentations about OBIEE with sessions on the frontiers of data analysis. I'm not going to cover everything, just dipping into a few things which struck me during the day
During the day somebody described dashboards as "Fisher Price activity centres for managers". Well, Neil Sellers showed a mobile BI app called RoamBI which is exactly that. Swipe that table, pinch that graph, twirl that pie chart! (No really, how have we survived so long with pie charts which can't be rotated?) The thing is so slick, it'll keep the boss amused for hours. Neil's theme on the importance of data visualization to convey a message or tell a story was picked up by Claudio Bastia and Nicola Sandol. Their presentation included a demo of IConsulting's Location Intelligence extension for OBIEE. The tool not only does impressive things with the display of geographic data, it also allows users to interact with the maps to refine queries and drill down into the data. This is visualization which definitely goes beyond the gimmick: it's an extremely powerful way of communicating complex data sets.
A couple of presentations quoted the statistic that 90% of our data was created in the last two years. This is a figure which has been bandied about but I've never seen a citation which explains who calculated it and what method they used (although it's supposed to have originated at IBM). It probably comes from the same place as most other statistics (and project estimates). What is the "data" the figure measures? I'm sure in some areas of human endeavour (bioinformatics, say, or CERN) the amount of data they produce has gone metastatic. And obviously digital cameras, especially on phones, are now ubiquitous, so video and photographs account for a lot of the data growth. But are selfies, instagrammed burgers and cute kittens really data? Same with other content: how much of this data explosion is mirroring, retweets, quoting, spam and AdSense farms? Not to mention the smut. Anyway, that 90% was first cited in 2012; it's now 2013 and somebody needs toinvent derive a new figure.
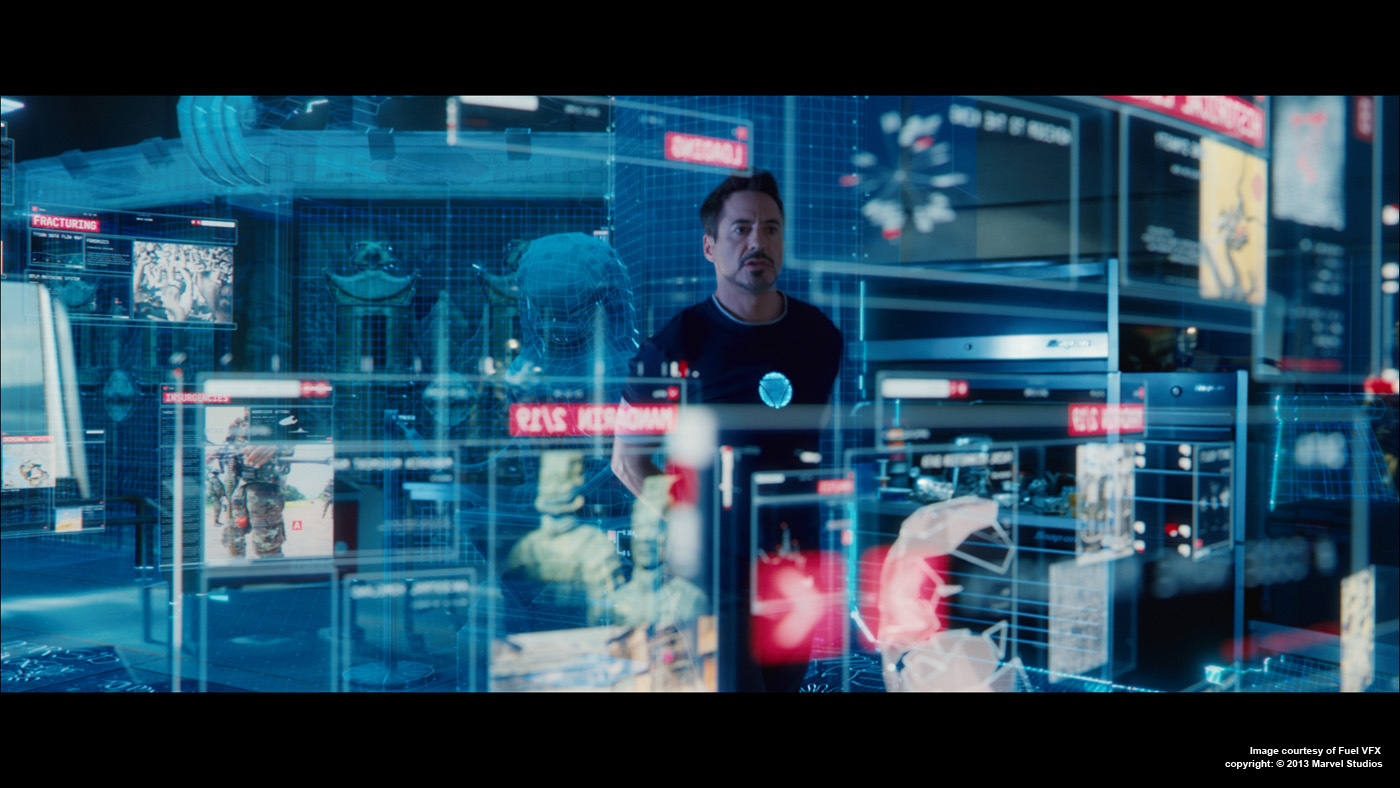
The day rounded off with a panel and a user presentation. Toby Price opened the Q&A by asking Oracle's Nick Whitehead, how does Hadoop fit into an Oracle estate? It's a good question. After all, Oracle has been able to handle unstructured data, i.e. text, since the introduction of ConText in 8.0 (albeit as a chargeable extra in those days). And there's nothing special about MapReduce: PL/SQL can do that. So what's the deal with Hadoop? Here's the impertinent answer to this pertinent question: Hadoop allows us to run massively parallel jobs without paying Oracle's per processor licenses. Let's face it, not even Tony Stark could afford to run a one-thousand core database.
The closing session was a presentation from James Wyper & Dirk Shelley about upgrading the BI architecture at John Lewis Partnership. They described it as a war story, but actually it was a report from the front lines, because the implementation is not yet finished. James and Dirk covered the products - which ones worked as advertised, which ones gave them grief (integration was a particular source of grief). They also discussed their approach to the project, relating what they did well and what they would do differently with the advantage of hindsight. This sort of session is the best part of any user group: real users sharing their experiences with the community. We need more of them.
During the day somebody described dashboards as "Fisher Price activity centres for managers". Well, Neil Sellers showed a mobile BI app called RoamBI which is exactly that. Swipe that table, pinch that graph, twirl that pie chart! (No really, how have we survived so long with pie charts which can't be rotated?) The thing is so slick, it'll keep the boss amused for hours. Neil's theme on the importance of data visualization to convey a message or tell a story was picked up by Claudio Bastia and Nicola Sandol. Their presentation included a demo of IConsulting's Location Intelligence extension for OBIEE. The tool not only does impressive things with the display of geographic data, it also allows users to interact with the maps to refine queries and drill down into the data. This is visualization which definitely goes beyond the gimmick: it's an extremely powerful way of communicating complex data sets.
A couple of presentations quoted the statistic that 90% of our data was created in the last two years. This is a figure which has been bandied about but I've never seen a citation which explains who calculated it and what method they used (although it's supposed to have originated at IBM). It probably comes from the same place as most other statistics (and project estimates). What is the "data" the figure measures? I'm sure in some areas of human endeavour (bioinformatics, say, or CERN) the amount of data they produce has gone metastatic. And obviously digital cameras, especially on phones, are now ubiquitous, so video and photographs account for a lot of the data growth. But are selfies, instagrammed burgers and cute kittens really data? Same with other content: how much of this data explosion is mirroring, retweets, quoting, spam and AdSense farms? Not to mention the smut. Anyway, that 90% was first cited in 2012; it's now 2013 and somebody needs to
The day rounded off with a panel and a user presentation. Toby Price opened the Q&A by asking Oracle's Nick Whitehead, how does Hadoop fit into an Oracle estate? It's a good question. After all, Oracle has been able to handle unstructured data, i.e. text, since the introduction of ConText in 8.0 (albeit as a chargeable extra in those days). And there's nothing special about MapReduce: PL/SQL can do that. So what's the deal with Hadoop? Here's the impertinent answer to this pertinent question: Hadoop allows us to run massively parallel jobs without paying Oracle's per processor licenses. Let's face it, not even Tony Stark could afford to run a one-thousand core database.
The closing session was a presentation from James Wyper & Dirk Shelley about upgrading the BI architecture at John Lewis Partnership. They described it as a war story, but actually it was a report from the front lines, because the implementation is not yet finished. James and Dirk covered the products - which ones worked as advertised, which ones gave them grief (integration was a particular source of grief). They also discussed their approach to the project, relating what they did well and what they would do differently with the advantage of hindsight. This sort of session is the best part of any user group: real users sharing their experiences with the community. We need more of them.
Subscribe to:
Posts (Atom)